Automated response to C2 traffic on your devices
Over the course of the weekend I stumbled over the Feodo Tracker project in my twitter feed. The project tracks active C2 servers associated with Dridex, Emotet/Heodo, TrickBot and QakBot malware. You can actively browse the list of servers or download the data as CSV.
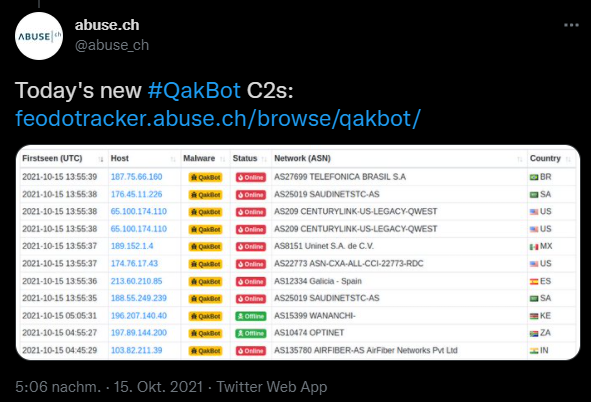
The provided blocklist is available in different variations. As a CSV that contains all ip addresses of active C2 servers, as well as all ip addresses that where active in the last 30 days, a blocklist for e.g. your firewall containing only active C2 server ip addresses, and a full list of all ip addresses ever associated with C2 activity. The last one should not be used because the ip addresses of those servers change a lot and get reused by legitimate sites.
In this article I will use the recommended IP blocklist to show you two ways to detect and/or block connections from your MDE protected endpoints to those ip addresses.
Advanced Hunting
Advanced hunting queries are written in KQL and this query language allows you to easily include external data in your queries through the externaldata operator. This makes it a great fit for our task. Also in MDE a custom detection rule is always rooted in a advanced hunting query.
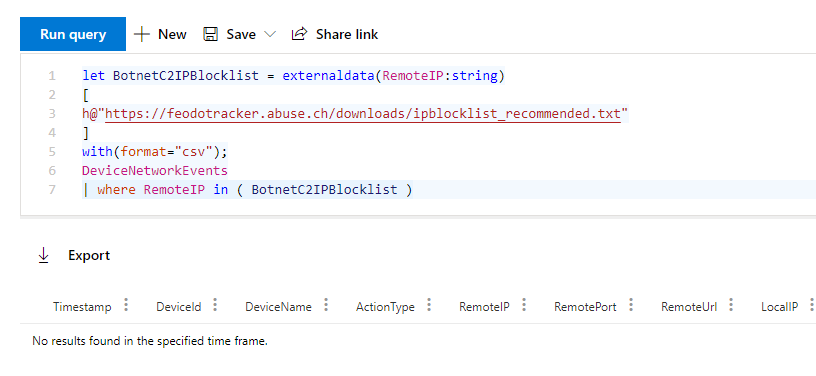
The following KQL query imports the file from https://feodotracker.abuse.ch/downloads/ipblocklist_recommended.txt and creates a virtual table named BotnetC2IPBlocklist with one column RemoteIP.
Then it queries the DeviceNetworkEvents table and checks if any one of your devices mane a connection to one of the ip addresses in the BotnetC2IPBlocklist table.
let BotnetC2IPBlocklist = externaldata(RemoteIP:string)
[
h@"https://feodotracker.abuse.ch/downloads/ipblocklist_recommended.txt"
]
with(format="csv")
| where RemoteIP !startswith "#";
DeviceNetworkEvents
| where RemoteIP in ( BotnetC2IPBlocklist )
If you run the query, hopefully it will return no results.
Update
After publishing my inital blog post I contacted the team at abuse.ch and they where so kind to publish the 30 days list as a JSON file.
This allowed my to create a bit more advanced query that does not only match the ip address but also the port. Therefore this should result in less false positives when the computer is not contacting the C2 instance directly.
externaldata(RemoteIP: string, RemotePort: int, Status: string)
[
h@"https://feodotracker.abuse.ch/downloads/ipblocklist.json"
]
with(format="MultiJSON", ingestionMapping='[{"Column":"RemoteIP","Properties":{"Path":"$.ip_address"}}, {"Column":"RemotePort","Properties":{"Path":"$.port"}}, {"Column":"Status","Properties":{"Path":"$.status"}}]')
| where Status == "online"
| join kind=inner DeviceNetworkEvents on RemoteIP, RemotePort
Custom detection rule
What we did here was a one time manual query to see if there where any connections and if the syntax was good. A custom detection rule let’s you automate this task easily.
To create a custom detection rule your advanced hunting query has to have at least the following information. Luckily this is almost always the case if you do not manually remove columns from the output.
- Timestamp, to map the alerts to any other related events
- DeviceId, to map the device to the alert
- ReportId, to extract the data from the report and present it to the analyst
Since all this information is already in there, click “Create detection rule” after you ran the query to start the wizard.

Alert details
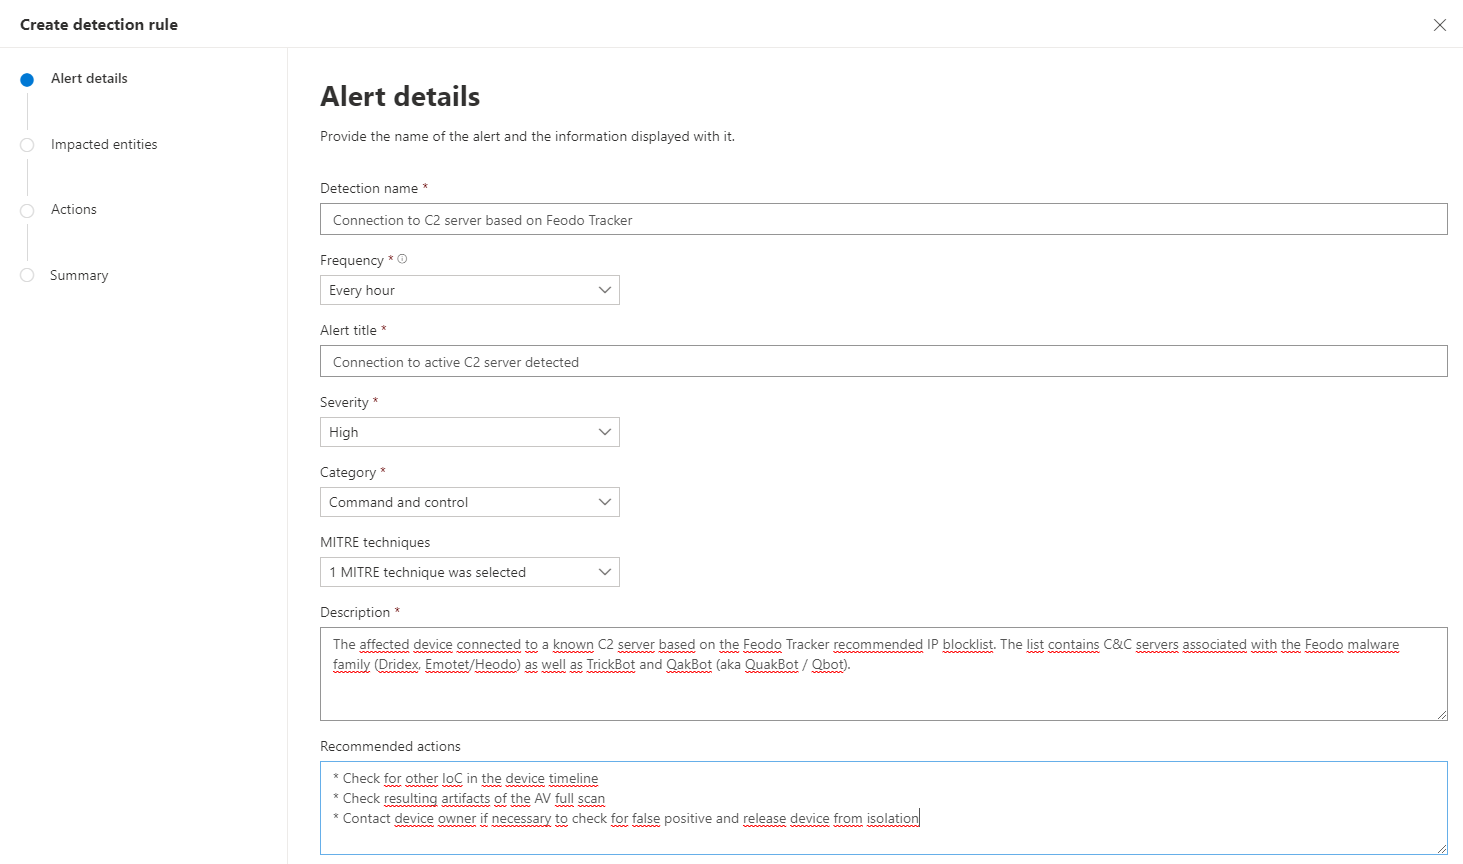
Enter a detection name, in this example I use Connection to C2 server based on Feodo Tracker. This is not what the analyst is going to see but a internal name for you.
With frequency you can change how often the query is run. In this case I selected the minimum interval of one hour, because I want a fast detection to action time.
The alert title is what will show up in the portal so choose something descriptive e.g. Connection to active C2 server detected
Chose a severity level that fits your internal processes.
For category I used “Command and control” and as MITRE techniques “T1102 Web Service”.
Description and Recommended actions should be as descriptive and helpful to the analyst as possible.
Impacted entities
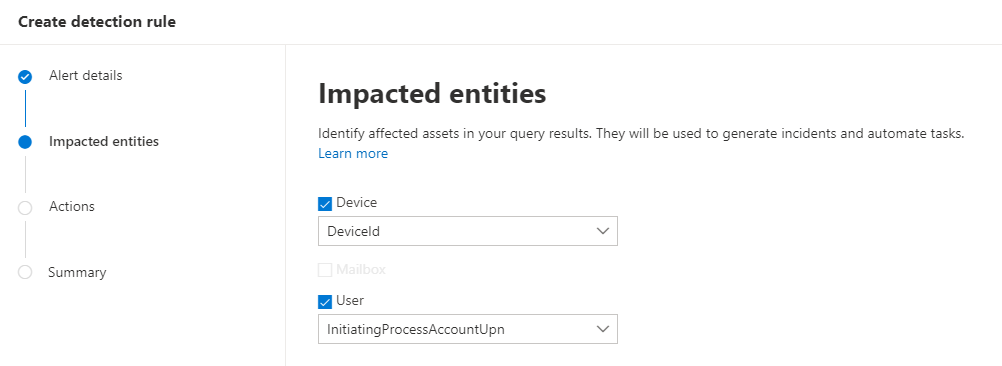
The next step is to map the impacted entities from the data provided in the query. In this case I use DeviceId to map the device impacted and the account UPN that was owner of the process to find the affected user.
Actions
In the actions section you can define multiple actions that should be taken when this event occurs. This gives you great auto remediation option.
- Isolate device in “Full mode” blocks of any network connectivity other than communication to the Microsoft Defender for Endpoint service. In “Selective mode” everything but traffic to the Microsoft Defender for Endpoint service, Outlook, Microsoft Teams, and Skype for Business is blocked. The users is still able to do some work and also it does not cut of anz direct communication channels to the enduser.
- Run antivirus scan does exactly that, it triggers a full scan of the affected device
- Initiate investigation start an automated investigation and everything found in this investigation is also added to the created incident
- Restrict app execution hinders the attacker to start additional payload on the device. Only software signed by a Microsoft issued certificate can be started on the device.
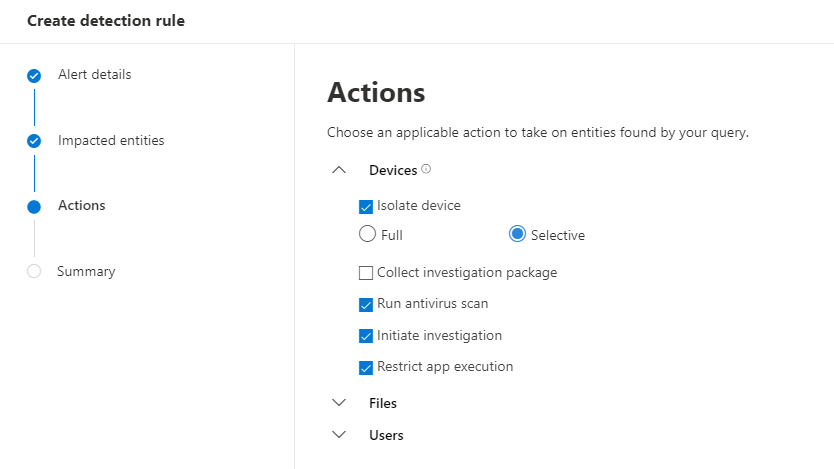
The last step is to check your custom detection in the summary and create it.
After that your custom detection can be found and changed under Hunting -> Custom detection rules

Test custom detection
In this case it’s quite easy to check if the detection works as expected. Just use Test-NetConnection -Port 443 -ComputerName IP and replace the IP with any of the IP addresses in the block list. After you have done this you will have to wait until the custom detection is executed or you can speed things up by triggering a manual run.
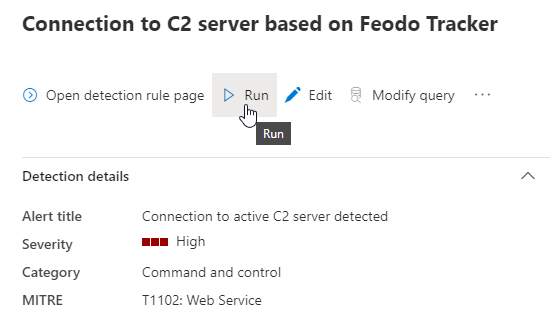
The alert should be triggered and an corresponding incident should be created.

In the alert view you also should see the triggered actions based on your configuration.

Custom IoC
The presented method of using custom detections enables you to to detect even the most custom scenarios, as long as you can translate it to a Kusto query. But because the detection time is about one hour, this is not the ideal solution to block such an attack in realtime. This is where custom indicators come into play.
Custom network indicators allow you to block connections on the endpoint which makes it an ideal candidate for zero trust architecture where you have no centralized firewall or proxy setup and your devices might be on private WiFi hotspots because of remote work or travel.
You must enable custom network indicators in the Microsoft Defender for Endpoint advanced settings to use this feature.

There are multiple ways to update custom IoCs, one of them is to upload a CSV file with the indicators.
CSV Import
The CSV example file you can download from the portal provides some guidance on how you have to format your data to import it via the portal. One very important column is the ExpirationTime. This makes it very easy to only import active C2 server ip addresses while old ones automatically get deleted. This minimizes false positives through old IoC.
IndicatorType,IndicatorValue,ExpirationTime,Action,Severity,Title,Description,RecommendedActions,Scope/DeviceGroups,Category,MitreTechniques,GenerateAlert
IpAddress,78.105.213.151,2018-09-16T12:11:06.2446367Z,Allowed,Informational,"Ip Address custom TI example","malware downloader","Recommended actions should be here","","","",false
Based on this data model I created this PowerShell script that fetches the current blocklist and creates an import ready csv.
# Download latest CSV blocklist
$Blocklist = Invoke-WebRequest -UseBasicParsing -Uri "https://feodotracker.abuse.ch/downloads/ipblocklist_recommended.txt"
# Split in multiline string an remove comments
$Blocklist = $Blocklist.Content -split "`r`n" | Select-String -NotMatch -Pattern "^#"
# Get current date + 2 hours
$ExpirationTime = Get-Date -Format "o" -Date (Get-Date).ToUniversalTime().AddHours(2)
# Generate IoC CSV
$IoC = foreach ($BlockIP in $Blocklist) {
    [PSCustomObject]@{
        'IndicatorType' = "IpAddress"
        'IndicatorValue' = $BlockIP
        'ExpirationTime' = $ExpirationTime
        'Action' = 'Block'
        'Severity' = 'High'
        'Title' = 'Connection to active C2 server detected'
        'Description' = 'Connection to C2 server based on Feodo Tracker blocklist'
        'RecommendedActions' = 'Check machine for any signs of infections'
        'Scope/DeviceGroups' = ''
        'Category' = ''
        'MitreTechniques' = ''
        'GenerateAlert' = 'true'
    }
}
$IoC | Export-Csv -Path .\feodo-ioc-blocklist.csv -Delimiter "," -NoClobber -NoTypeInformation
After the file is created you can upload it to the MDE portal.
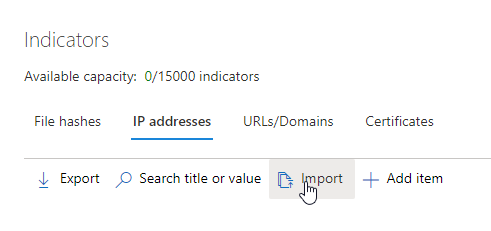
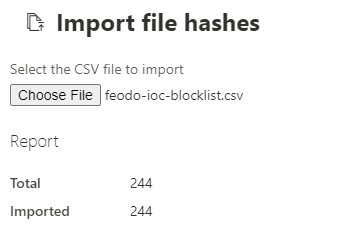
As soon as the IoCs are active you can check on your endpoint if everything works as expected. Based on which application the enduser uses one of the following messages is displayed.
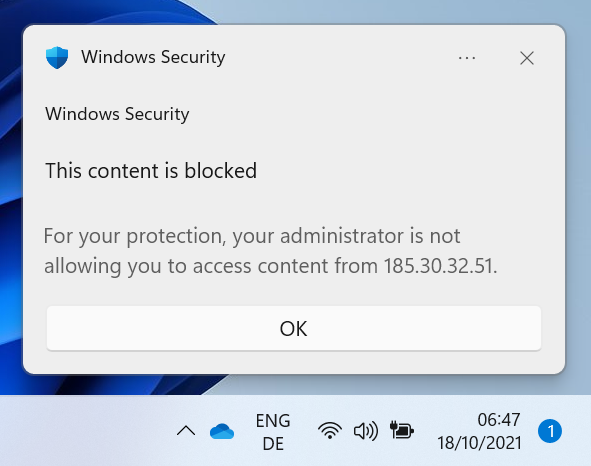
Blocked by Network Protection
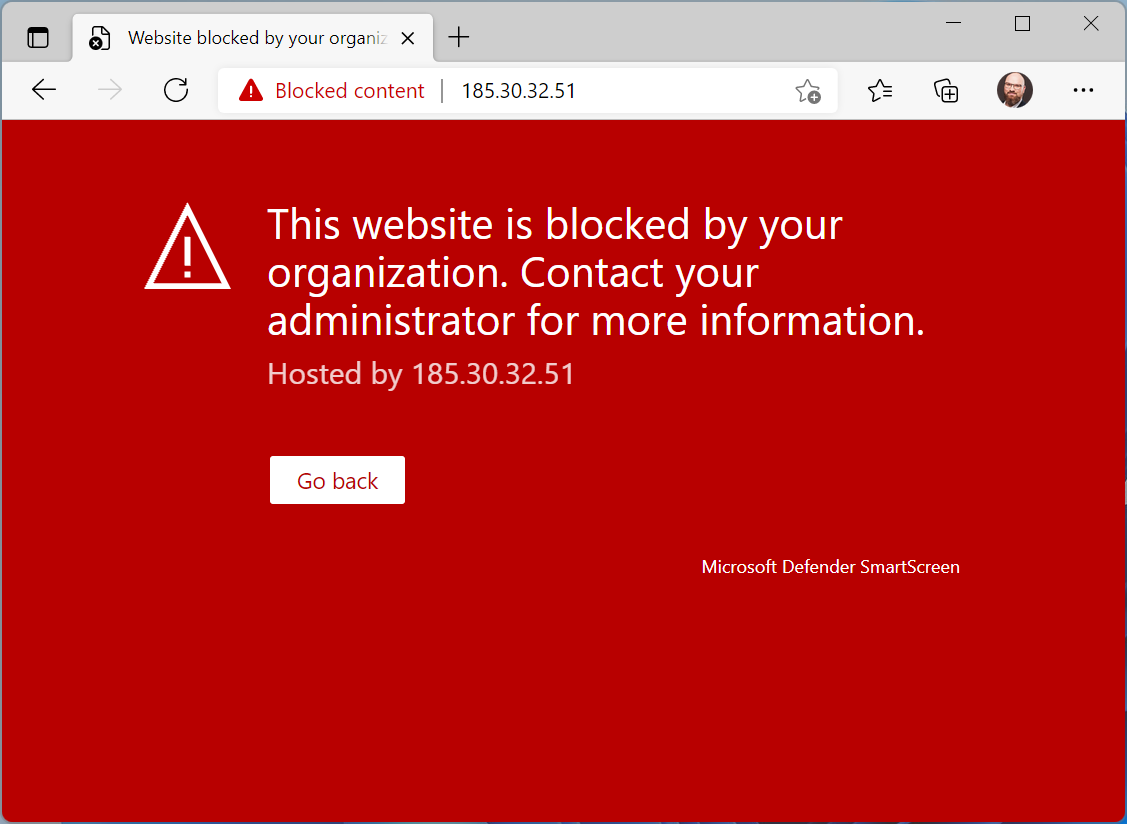
Blocked by SmartScreen
Fully automated with Azure Automation
If the PoC sparked your interest I will show you how I implemented a fully automated solution using Azure Automation.
This is not a click by click explanation, but more of an overview for you to implement something similar yourself.
Basic know how in Azure and Azure Automation is required.
First create a Entra ID (Azure AD) application registration which is used to authenticate.
Add the following permissions to your newly created application and grant those. You will need to be in one of the following roles to do this. Global Administrator, Privileged Role Administrator, Cloud Application Administrator, or Application Administrator.

Add a client secret for the application and take note of the secret value. You will need it in a minute.

Now deploy the following ARM template.
At a minimum you will have to enter the application id and the the application secret. The Automation Account name can be changed as you like. Do not change Tenant Id, Location or BaseTime.
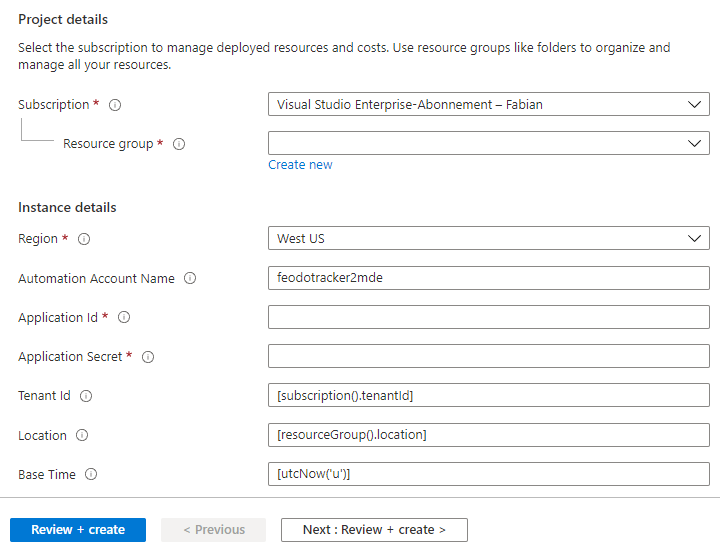
If you don’t what to use the provided ARM template you can also create the following yourself.
- Automation Account
- Runbook with the code provided below or here
- Scheduler set to one hour
- Link between Scheduler and Runbook
[CmdletBinding()]
param (
    [Parameter(Mandatory = $true)]
    [string]
    $ApplicationId,

    [Parameter(Mandatory = $true)]
    [string]
    $TenantId
)

function Invoke-IndicatorImport {
    param (
        $Body,
        $Headers
    )
    #region Import indicators
    try {
        $Response = Invoke-RestMethod -Method Post -Headers $Headers -Body $Body -UseBasicParsing -Uri "https://api.securitycenter.microsoft.com/api/indicators/import"
        foreach ($ReturnValue in $Response.value) {
            if ($ReturnValue.isFailed) {
                Write-Warning "Could not import indicator`t $($ReturnValue.indicator) because:`t $($ReturnValue.failureReason)"
            } else {
                Write-Output "Successfully imported indicator`t $($ReturnValue.indicator)"
            }
        }
    } catch {
        Write-Warning "$($($_.Exception).Message)"
    }
    #endregion
}

# Retrieve application secret
$AppSecret = Get-AutomationVariable -Name 'AppSecret'

#region Connect to Defender for Endpoint service API
$body = @{
    "resource"      = "https://api.securitycenter.windows.com"
    "client_id"     = $ApplicationId
    "client_secret" = $AppSecret
    "grant_type"    = "client_credentials"
}
$Response = Invoke-RestMethod -Method Post -Body $body -UseBasicParsing -Uri "https://login.windows.net/$TenantId/oauth2/token"
$AccessToken = $Response.access_token

$Headers = @{
    'Content-Type'  = 'application/json'
    'Accept'        = 'application/json'
    'Authorization' = "Bearer " + $AccessToken
}
#endregion

# Download latest CSV blocklist and filter out offline servers
try {
    $Blocklist = Invoke-RestMethod -Method Get -UseBasicParsing -Uri "https://feodotracker.abuse.ch/downloads/ipblocklist.json"
    $Blocklist = $Blocklist | Where-Object status -EQ "Online"
} catch {
    throw "Could not download list of indicators - $($($_.Exception).Message)"
}

# Get current date + 2 hours
$ExpirationTime = Get-Date -Format "o" -Date (Get-Date).ToUniversalTime().AddHours(2)

#region Generate IoC JSON
# https://docs.microsoft.com/en-us/microsoft-365/security/defender-endpoint/import-ti-indicators
$i = 0
$Indicators = New-Object System.Collections.ArrayList
foreach ($BlockIP in $Blocklist) {
    $Indicators.Add( @{
            indicatorValue     = "$($BlockIP.ip_address)"
            indicatorType      = "IpAddress"
            action             = "Block"
            generateAlert      = "False"
            severity           = "High"
            title              = "Connection to active C2 server detected"
            description        = "Connection to C2 server based on Feodo Tracker blocklist.`n`nAdditional information:`nMalware type: $($BlockIP.malware)`nFirst seen: $($BlockIP.first_seen)`nLast online date: $($BlockIP.last_online)`nTCP port: $($BlockIP.port)"
            recommendedActions = "Check machine for any signs of infections"
            expirationTime     = $ExpirationTime
        }) | Out-Null
    $i++
    if ($i -eq 500) {
        # Body is limited to 500 indicators per request
        $BodyJSON = @{ "Indicators" = $Indicators } | ConvertTo-Json
        Invoke-IndicatorImport -Headers $Headers -Body $BodyJSON
        # Clear indicators array
        $Indicators = New-Object System.Collections.ArrayList
        # Reset counter
        $i = 0
    }
}

if ( $Indicators.Count -gt 0) {
    # Submit last batch of indicators
    $BodyJSON = @{ "Indicators" = $Indicators } | ConvertTo-Json
    Invoke-IndicatorImport -Headers $Headers -Body $BodyJSON
}
#endregion
Now check if everything works as expected by manually starting the runbook. You will have to provide the Application Id as well as the Tenant Id.
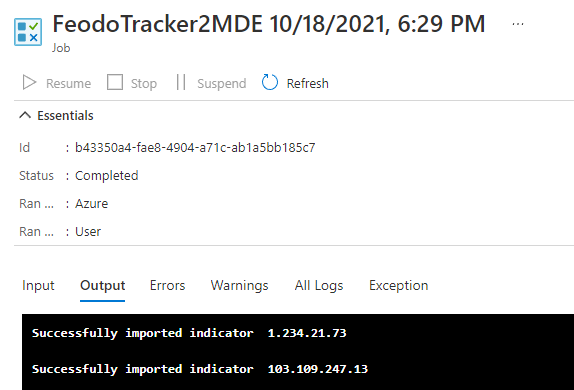
The configured scheduler is set to 1 hour. Do not let the scheduler run anything below 5 minutes to avoid unnecessary load on the servers of abuse.ch. Check the terms of service and consider a donation.

That’s it. You successfully protected your client against a additional known evil without breaking a sweat.
Conclusion
Custom detection rules as well as custom indicator can help you get detailed alerts and also allow, in combination with features like network block, to extend the reach of your company firewall to all endpoints and prevent unwanted communication.
Because of the open API it is possible to automate such solution and the integration shown here can easily be used as a blueprint for other data sources. Also check out the Azure Logic App connector which allows you to automate tasks without much scripting.
It should be noted that many of the capabilities mentioned here are not yet available on all platforms. But Microsoft has released the modern unified solution for Windows Server 2012 R2 and 2016 Preview which includes many of the new features like network protection.